
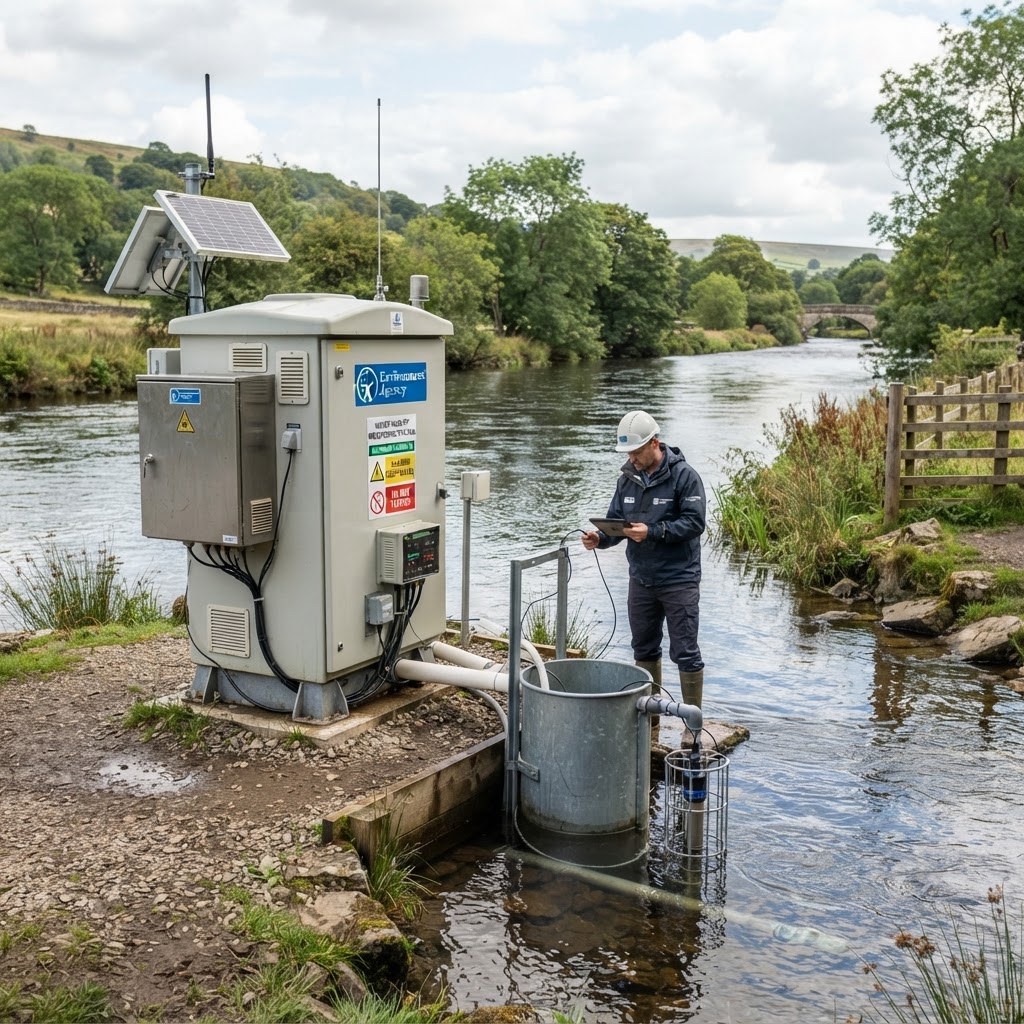
Water industry mapping in the UK brings together many different datasets: where a sewer overflow is located, what its monitoring record says, where the Environment Agency samples water quality, which water company serves an area, and the extent of rivers, catchments, groundwater and reservoirs. These are related questions, but no single water map proves every answer. Maplify makes the public layers easier to compare at a location while linking you back to the relevant source records.
This guide explains how to check sewage spill locations, combined sewer overflows (CSOs), river water quality monitoring sites, sewage treatment works, drinking water protection zones, water pipes, reservoirs and water-body classifications on one interactive map, including the difference between an indicative asset point and a verified regulatory measurement.
Open Maplify, select Map layers → Water Industry, then enable the source layers you need. Click a point to inspect its available source fields; open the matching guide for the dataset's geography, legend and limitations.
Open the sewage overflow and water quality map → · Browse Water Industry layers →
Which Water Industry Layers Can You See on Maplify?
The map's Water Industry accordion groups the available overlays into six practical sections. Each has its own data-layer guides and original-source context:
- Sewage & Wastewater: wastewater works and treated-effluent discharges, storm overflows and historical consented discharge points.
- Drinking Water: public waterworks, company areas and drinking-water protected areas, alongside groundwater Source Protection Zones.
- Pipe Networks: mapped water mains, sewer pipes and pumping stations from incomplete OpenStreetMap records.
- Reservoirs & Storage: mapped reservoir outlines; reservoir-failure flood scenarios are a separate flood-risk overlay.
- Water Quality & Monitoring: water quality monitoring stations, WFD water bodies, protected waters and bathing-water designations.
- Catchments & Resources: river basin districts, water bodies and groundwater, with live England river-level monitoring.
How to Find Sewage Spill Locations on a Map
Start with the Storm Overflows (CSO) map layer. A combined sewer overflow is an engineered release point within a sewerage system that may discharge a mixture of rainwater and wastewater under certain circumstances. A mapped marker identifies a reported location; it does not mean a spill is occurring at that moment.
- Search the town, property or river reach in Maplify and open Water Industry → Sewage & Wastewater → Storm Overflows (CSO).
- Zoom in and select an overflow marker to view the published source attributes available for that location.
- Identify the relevant water and sewerage company, the discharge or asset reference where available, and the receiving water body.
- Cross-reference the location against the Environment Agency's annual Event Duration Monitoring (EDM) returns for the relevant calendar year.
- Use the detailed start/stop monitoring release or an operator's live overflow feed for more granular monitoring evidence where available.
- Check nearby water quality stations and WFD water bodies before interpreting environmental implications.
What Does an Annual Spill Count Tell You?
The EA's 2025 annual EDM return, updated in September 2026, reports how often and for how long monitored storm overflows discharged in the recorded year. The public releases also contain monitoring coverage and quality information. Spill count, total duration, monitoring operability and real-time status are different measures. Comparisons should use the same year and account for missing or amended monitoring data.
In October 2026 the EA published detailed annual start/stop data and a 2026 year-to-August release. Its documentation states that these activation records were not formally verified by the EA. A long or frequent activation history can guide further questions, but it cannot alone diagnose illegal activity, ecological harm or current pollution levels. The EA's environmental permits public register provides a separate route to checking current discharge permissions.
How to View River Water Quality Monitoring Sites
Switch on Water Quality Monitoring to locate published sampling points. Sampling stations are not continuous pollution sensors: an observation must be read together with its sampled substance, unit, sample date, sampling location and analytical context. The Environment Agency's Water Quality Explorer provides access to measured chemistry samples and historical records.
Useful parameters include phosphate and other phosphorus measures, nitrate, ammonia, dissolved oxygen, biochemical oxygen demand, temperature, pH, conductivity, metals and pesticides where sampled. A site may not have been tested for each substance. Some data may refer to different sampling campaigns or laboratory methods; compare like with like rather than treating an isolated result as a full environmental health assessment.
Does a Monitoring Point Show Whether a River Is Polluted?
Not automatically. A coloured map marker generally tells you where observations were collected; it is not a reliable overall water-quality rating. Find the dated laboratory records, check the measured parameter and any applicable standard, then compare them with upstream/downstream stations and the relevant WFD classification. Avoid attributing poor quality to a nearby CSO or treatment works without hydrological, time-series and other supporting evidence.
What Are Water Framework Directive River and Lake Classifications?
The Water Framework Directive (WFD) datasets identify river, lake, coastal and groundwater bodies used in regulatory assessment. Ecological status, chemical status and reasons for failing objectives are distinct from individual sampling results. Use Maplify's WFD and catchment layers for the mapped geography, then check the EA Catchment Data Explorer for dated classifications and pressures.
One important mapping distinction: the layer formerly labelled as individual river catchments is configured against a larger river basin district source. It is not a fine-grained stream catchment or an engineered drainage basin. Some currently configured WFD overlays also use historic Cycle 2 services, so current classification cycles need separate verification.
Can You Map Sewage Treatment Works, Outfalls and Wastewater Pipes?
Maplify combines several sources but does not present them as one authoritative national utility asset register. A publicly mapped treated-effluent discharge point is not necessarily the position of a full treatment works. Wastewater plant locations, sewer pipes and pumping stations from OpenStreetMap are incomplete, and most buried infrastructure does not appear on open map data.
For a planning application, connection enquiry or excavation, use the map for background orientation and request current water company sewer records, a connection assessment, statutory service searches and competent surveys. Missing lines must never be interpreted as no pipes or drains. This is especially important for building over sewers, road crossings, utility easements and major groundworks.
How to Check Drinking Water Protection and Company Areas
The Drinking Water section includes indicative mapped waterworks, water-company areas and source-protection-related designations. Company boundaries provide broad service-area context, not proof of an individual supply connection or guaranteed capacity. Source Protection Zones mark areas important to groundwater abstraction and contamination prevention; they do not represent the water pipe network.
A project involving fuel storage, construction compounds, agriculture, waste handling, contaminated land or significant earthworks should consider Source Protection Zones and applicable regulatory guidance. For supply, contact the appropriate undertaker and review Ofwat's sector information or the relevant company.
How to Interpret Reservoir and River-Level Maps
A reservoir outline can be used for drinking-water storage, irrigation, industry or recreation. It does not reveal ownership, present capacity, dam condition or safety. Reservoir-flooding scenarios are a distinct overlay and should be assessed with the relevant official source when a downstream site is affected.
Live River Levels gives England river-gauge readings and station timestamps from the EA flood-monitoring service. A rising level is not itself a property flood forecast, and measurements outside England may need separate devolved-agency feeds.
Water Sector Mapping: A Practical Site Due-Diligence Checklist
- Locate the correct site boundary and nearby rivers, streams and reservoirs.
- Check flood zones and surface-water risk separately from pollution or CSO layers.
- Inspect mapped CSO and treated-effluent discharge points; identify the original source and its date.
- Cross-check the annual EDM returns before describing any site's spill history.
- Find water-quality sampling locations and open the dated laboratory observations.
- Review the relevant WFD water-body status and identified pressures.
- Check water company service areas and source protection designations.
- Request official sewer, water-main and connection-capacity records for the development itself.
- Document missing datasets and source limits rather than interpreting blank maps as a clean bill of health.
Frequently Asked Questions About Water Industry Maps
Can I see all sewage spills in the UK live?
No. Maplify plots the storm-overflow locations available in its configured public source. Annual EA EDM returns are historical, and live spill feeds vary by operator and region. A mapped location does not imply a current discharge.
Is the water quality monitoring map updated every minute?
No. Sampling-site positions and laboratory analysis observations follow their own publication schedules. The layer does not convert sample records into a continuous live water-quality forecast.
Does the map show every underground water pipe or sewer?
No. Publicly tagged pipe lines are extremely incomplete. Obtain current plans from the asset owner and follow safe-digging practices.
Can I see phosphate or nitrate test results?
You can identify sampling stations on Maplify and check the original EA Water Quality Explorer for the relevant dated results and substance codes. Not all parameters are shown as individually integrated live chemical heatmap layers.
Does a nearby sewage works prevent development?
Not automatically. Potential odour, noise, water quality, servicing or flood issues may need specialist assessment and consultation with the local planning authority and undertaker.
Which nations do the datasets cover?
Many regulator feeds in this guide focus on England. Public community mapping can extend further across the UK, but Scotland, Wales and Northern Ireland have separate competent authorities and data services.
Data Sources and Editorial Method
Maplify overlays public spatial records with different dates, legal bases and completeness. This article distinguishes mapped assets, statutory boundaries, sampled measurements, monitoring activation history and current permissions. It does not combine them into an invented single pollution score. Key sources include the EA annual storm-overflow returns, EDM detailed data, EA Water Quality Explorer, Catchment Data Explorer and OpenStreetMap attribution and licence.
Read Maplify's data source policy · Read accuracy and limitations · See the electricity network mapping guide.