
Britain's EV charging deserts
Which UK local authorities have the fewest public electric-vehicle chargers per 10,000 residents? Explore the national divide, rapid-charger provision and the property-market implications.
A national network with striking local gaps
As at 1 July 2026, Department for Transport statistics recorded 121,171 publicly accessible EV chargers across the UK, including 28,887 rated 50kW or above. These figures refer to public charging-capable EVSE units, not necessarily individual car parks or physical sites.
Among local authorities, North East Derbyshire had just 3.75 public chargers per 10,000 residents. Castle Point followed at 4.20 and Derry City and Strabane at 4.40. At the other end, Hammersmith and Fulham recorded 137.95 chargers per 10,000 residents.
This is a measure of geographic provision, not proof that an individual household cannot charge. Residents may use private home chargers, workplace facilities or chargers outside their council boundary; infrastructure reliability, power, pricing and local EV ownership also matter.
Why charging speed matters
London had 34.51 public chargers per 10,000 residents, above the UK average, but only 2.79 chargers rated 50kW or above per 10,000 residents, versus a UK rate of 4.17. A large network of slower on-street chargers is not equivalent to an abundance of high-powered charging capacity.
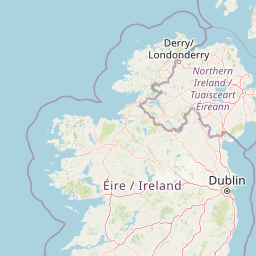
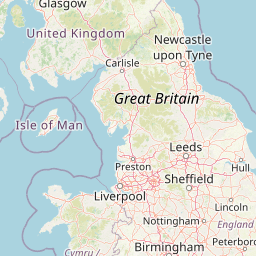
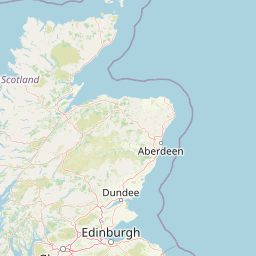
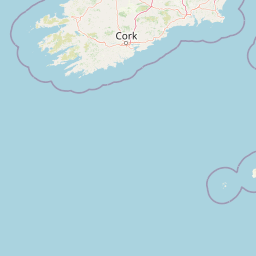
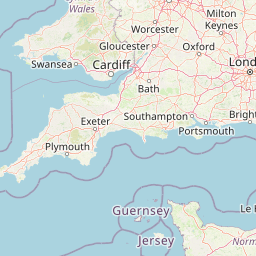
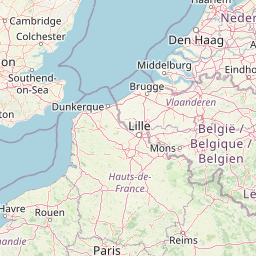
Interactive UK charging map
Compare local authorities by all public chargers, 50kW+ chargers or indicative resident density. Council boundaries do not represent individual towns or residential property footprints.




Where is provision lowest?
A national local-authority comparison. Lower figures indicate fewer public chargers relative to resident population, not necessarily poorer live availability.
| # | Local authority | Country | All chargers | 50kW+ | Rate per 10k residents |
|---|---|---|---|---|---|
| 1 | North East Derbyshire | England | 40 | 7 | 3.75 |
| 2 | Castle Point | England | 38 | 26 | 4.20 |
| 3 | Derry City and Strabane | Northern Ireland | 67 | 16 | 4.40 |
| 4 | Armagh City, Banbridge and Craigavon | Northern Ireland | 103 | 29 | 4.63 |
| 5 | Ards and North Down | Northern Ireland | 81 | 42 | 4.90 |
| 6 | Southend-on-Sea | England | 95 | 49 | 5.13 |
| 7 | Hastings | England | 47 | 22 | 5.15 |
| 8 | Mid Ulster | Northern Ireland | 80 | 26 | 5.24 |
| 9 | Fenland | England | 56 | 9 | 5.34 |
| 10 | Mid and East Antrim | Northern Ireland | 75 | 37 | 5.36 |
| 11 | Bolton | England | 170 | 91 | 5.48 |
| 12 | Bury | England | 109 | 53 | 5.48 |
| 13 | Newry, Mourne and Down | Northern Ireland | 102 | 25 | 5.57 |
| 14 | Knowsley | England | 92 | 59 | 5.66 |
| 15 | Hyndburn | England | 50 | 19 | 5.81 |
| 16 | Nuneaton and Bedworth | England | 84 | 50 | 5.93 |
| 17 | Tameside | England | 142 | 100 | 5.93 |
| 18 | Maldon | England | 42 | 17 | 6.08 |
| 19 | Sefton | England | 175 | 83 | 6.11 |
| 20 | Kirklees | England | 274 | 112 | 6.12 |
The full DfT geographic dataset is loaded. Search, filter and download the local-authority figures.
Public charging provision varies across the UK
Bars show all public chargers per 10,000 residents; hover to see the 50kW+ rate. Data: DfT, 1 July 2026.
Methodology and source material
Source and date. Official DfT/Zapmap EVCI0102 public charging infrastructure data for 1 July 2026, published 27 August 2026. Maplify divides official per-100,000-resident rates by 10; ranking geography is local authorities rather than individual towns.
Definitions. Counts are publicly accessible charging-capable units (EVSE); 'rapid or above' means 50kW+. Public network provision is not the same as charger availability, reliability, connector capacity or live occupancy.
Indicative resident density. The optional map view derives estimated residents per km² using the population implied by DfT rates and GIS geometry area. It does not represent address-level dwelling density or driveway availability and is provided for broad geographic context only.
Property limitations. This publication does not claim to measure every residential property's walking distance from a charger, households without off-street parking, or local EV ownership. Those questions require additional property-level and parking datasets.
Source coverage. DfT figures are based on Zapmap records and do not include domestic or non-public workplace chargers. The dataset is a dated snapshot, not a live charger-status feed. Local authority boundaries and statistics are loaded from the DfT geographic service when available.